par(las = 1, mfrow = c(1, 1), mar = c(4.5, 4.5, 2, 4.5))
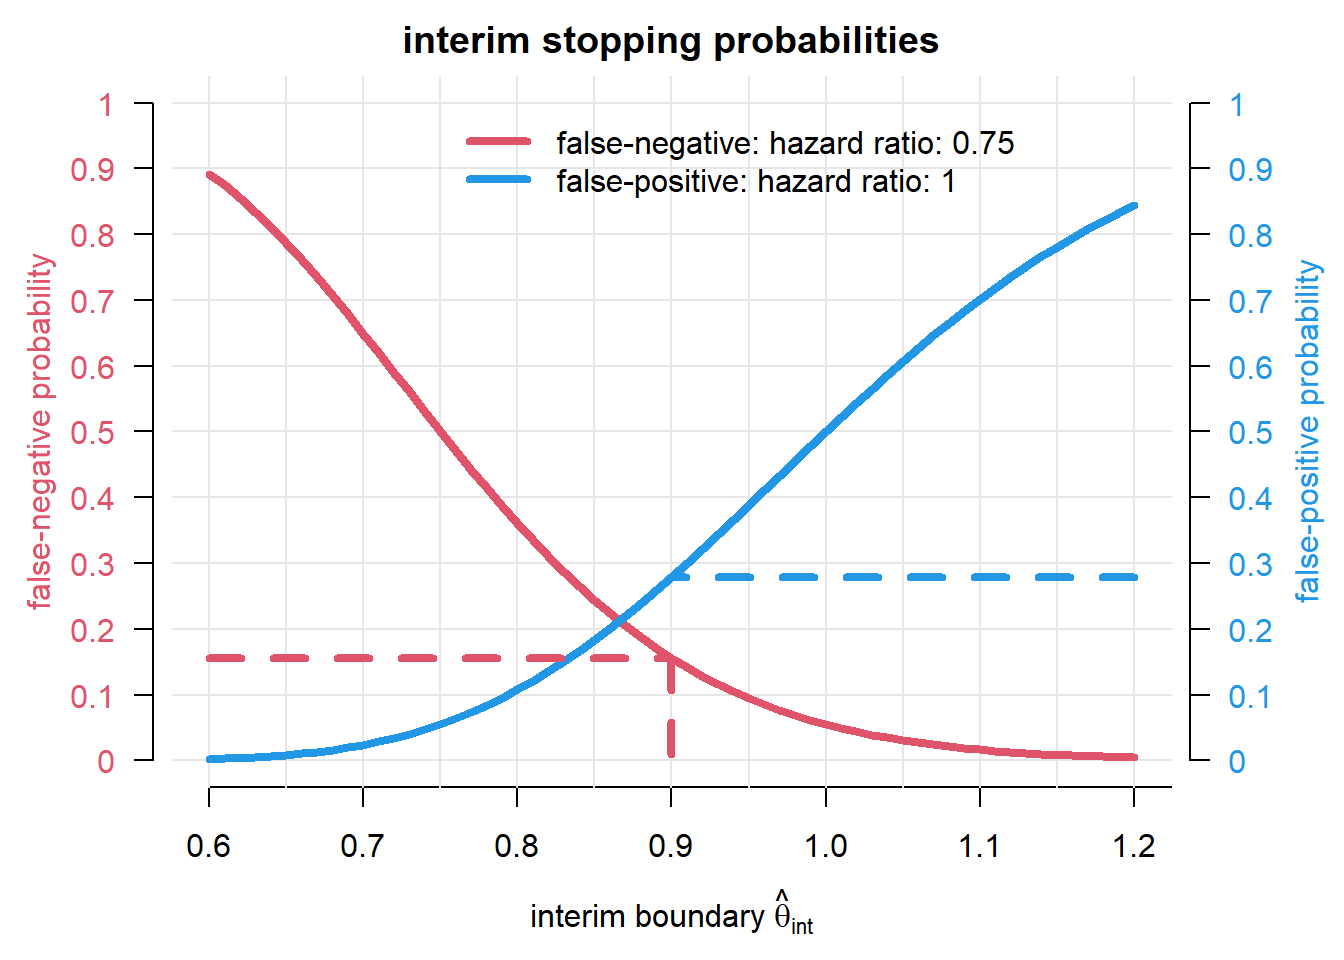
plot(hrs2, stopprob0, type = "n", xlab = expression("interim boundary "*hat(theta)[int]),
ylab = "", ylim = c(0, 1), axes = FALSE, main = "interim stopping probabilities")
axis(1, at = seq(0.6, 10, by = 0.1))
abline(v = seq(0.6, 10, by = 0.05), h = seq(0, 1, by = 0.1), col = gray(0.9))
legend(0.75, 1, paste("false-", c("negative", "positive"), ": hazard ratio: ", c(hr, 1), sep = ""),
col = c(2, 4), lwd = 4, bty = "n")
axis(2, at = seq(0, 1, by = 0.1), labels = seq(0, 1, by = 0.1), col.axis = 2, line = 0.5)
mtext("false-negative probability", 2, line = 3, col = 2, las = 3)
axis(4, at = seq(0, 1, by = 0.1), labels = seq(0, 1, by = 0.1), col.axis = 4, line = 0.5)
mtext("false-positive probability", 4, line = 3, col = 4, las = 3)
lines(hrs2, stopprob1, col = 2, lwd = 4)
lines(hrs2, 1 - stopprob0, col = 4, lwd = 4)
segments(min(hrs2), fn, sp_bound, fn, col = 2, lty = 2, lwd = 4)
segments(sp_bound, fn, sp_bound, 0, col = 2, lty = 2, lwd = 4)
segments(max(hrs2), fp, sp_bound, fp, col = 4, lty = 2, lwd = 4)